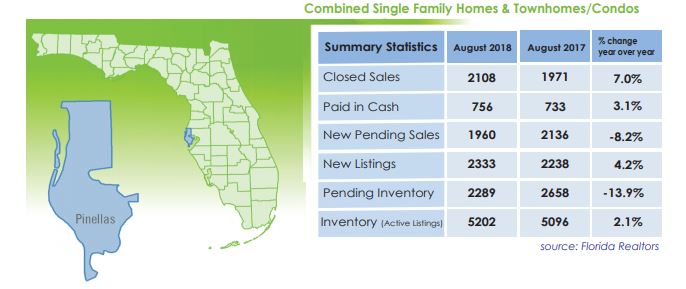
Dollar Volume & Sales Prices Up – reporting indicates a dramatic increase in dollar volume and the median sale price year-over-year this August.
- Dollar Volume for Single Family Homes saw a 14.0% increase from $368.3 million in August 2017, to $419.9 million in 2018.
- Dollar Volume for Townhome/Condo increased 13.3% year-over-year, with $171.4 million in August 2017, compared to $194.2 million in August 2018.
- The Median Sale Price for Single Family Homes was up by 7.6% from last year, at $255,000 for August 2018 versus $237,000 for
August 2017. - The Median Sale Price for Townhomes/Condos was $169,900 for August 2018, up 11.8% from $152,000 in August 2017.
Single Family
The Average Sale Price for Single Family Homes rose 6.9% from $298,701 in August 2017 to $319,287 in August 2018. The Median Time to Contract for Single Family Homes was 28 days in August 2018, up 16.7% from 24 days last August. The Median Time to Sale for Single Family Homes was 65 days this August, up 3.2% from 63 days last August.
The Months Supply of Inventory for Single Family Homes increased 12.0% year-over-year, with a 2.8 Month Supply this August, as compared to a 2.5 Month Supply in August 2017. New Listings for Single Family for August were 1,458, up 4.1% from last August, at 1,401.
The Active Listings for Single Family Homes rose 4.9% from 3,022 in August 2017 to 3,170 in August 2018. Closed Sales for Single Family were up 6.7% year-over-year, at 1,315 in August 2018 versus 1,233 in August 2017. Paid in Cash sales for Single Family increased 5.5%, from 343 in August 2017 to 362 in August 2018.
Condo/Townhome
The Average Sale Price for Townhome/Condo was $244,850 in August 2018, up 5.4% from $232,299 in August 2017. The Median Time to Contract for Townhome/Condo market was 33 days in August 2018, down 5.7% from 35 days last August.
The Median Time to Sale for Townhome/Condo market was 76 days in August 2018 and 79 days in 2017, down at 3.8%. The Months Supply of Inventory for Townhome/Condo remained the same at 2.7 months in August 2018 and August 2017. New Listings for Townhome/Condos for August 2018 were at 875, up 4.5% from 837 in August 2017.
Active Listings for Townhomes/Condos dipped 2.0% from 2,074 in August 2017 to 2,032 in August 2018. Closed Sales for the Townhome/Condo segment rose 7.5% year-over-year, at 738 in August 2017 versus 793 in August 2018. Paid in Cash sales for Townhome/Condo increased 1.0%, from 390 in August 2017 to 394 in August 2018.

Pinellas Realtor® Organization September, 2018
 " alt="" />