Dollar Volume & Sales Prices Up – reporting indicates a dramatic increase in dollar volume and the median sale price year-over-year this August.
- Dollar Volume for Single Family Homes saw a 14.0% increase from $368.3 million in August 2017, to $419.9 million in 2018.
- Dollar Volume for Townhome/Condo increased 13.3% year-over-year, with $171.4 million in August 2017, compared to $194.2 million in August 2018.
- The Median Sale Price for Single Family Homes was up by 7.6% from last year, at $255,000 for August 2018 versus $237,000 for
August 2017. - The Median Sale Price for Townhomes/Condos was $169,900 for August 2018, up 11.8% from $152,000 in August 2017.
Single Family
The Average Sale Price for Single Family Homes rose 6.9% from $298,701 in August 2017 to $319,287 in August 2018. The Median Time to Contract for Single Family Homes was 28 days in August 2018, up 16.7% from 24 days last August. The Median Time to Sale for Single Family Homes was 65 days this August, up 3.2% from 63 days last August.
The Months Supply of Inventory for Single Family Homes increased 12.0% year-over-year, with a 2.8 Month Supply this August, as compared to a 2.5 Month Supply in August 2017. New Listings for Single Family for August were 1,458, up 4.1% from last August, at 1,401.
The Active Listings for Single Family Homes rose 4.9% from 3,022 in August 2017 to 3,170 in August 2018. Closed Sales for Single Family were up 6.7% year-over-year, at 1,315 in August 2018 versus 1,233 in August 2017. Paid in Cash sales for Single Family increased 5.5%, from 343 in August 2017 to 362 in August 2018.
Condo/Townhome
The Average Sale Price for Townhome/Condo was $244,850 in August 2018, up 5.4% from $232,299 in August 2017. The Median Time to Contract for Townhome/Condo market was 33 days in August 2018, down 5.7% from 35 days last August.
The Median Time to Sale for Townhome/Condo market was 76 days in August 2018 and 79 days in 2017, down at 3.8%. The Months Supply of Inventory for Townhome/Condo remained the same at 2.7 months in August 2018 and August 2017. New Listings for Townhome/Condos for August 2018 were at 875, up 4.5% from 837 in August 2017.
Active Listings for Townhomes/Condos dipped 2.0% from 2,074 in August 2017 to 2,032 in August 2018. Closed Sales for the Townhome/Condo segment rose 7.5% year-over-year, at 738 in August 2017 versus 793 in August 2018. Paid in Cash sales for Townhome/Condo increased 1.0%, from 390 in August 2017 to 394 in August 2018.
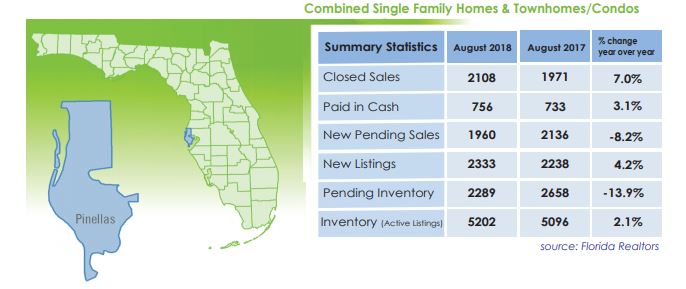
Pinellas Realtor® Organization September, 2018
 May 2018 – The Pinellas County housing market in April continued the trend of higher median sale prices and faster median time to contract for both Single Family Homes and Townhome/Condo. The most noticeable difference that breaks from what we’ve been seeing in 2018, is that for the first time since January 2018, new listings for the month were more than same month last year.
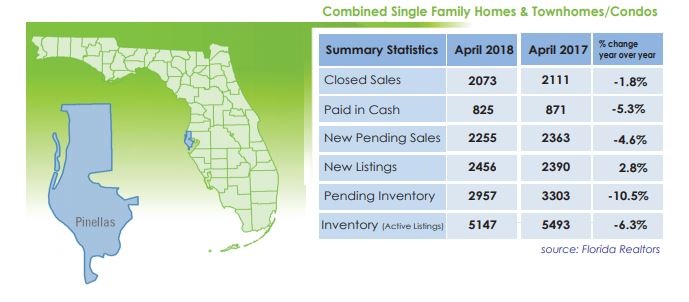

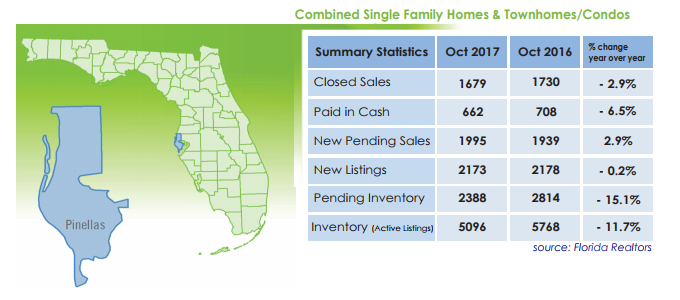
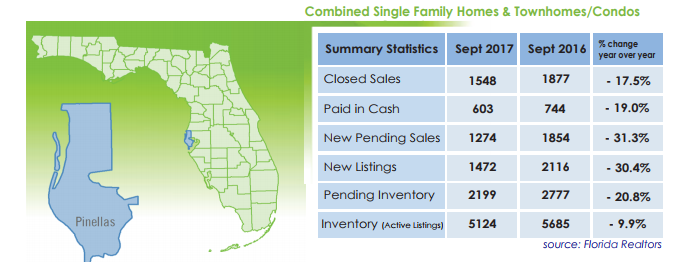
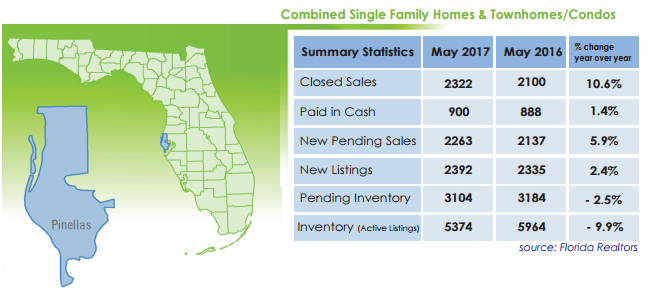
 Holiday season is here, and we have the latest statistics on the Pinellas real estate market to give thanks for.